Tables in PDF documents can present significant challenges, especially for individuals using screen readers like JAWS or NVDA. Here’s a closer look at the most common accessibility issues in PDF tables and how they impact usability:
Untagged or Incorrectly Tagged Tables
One of the most significant barriers in table accessibility is the lack of proper tagging. Untagged tables are interpreted by screen readers as a series of unstructured words and numbers, making it impossible for users to understand the relationships between rows and columns. Proper tagging ensures that assistive technologies convey the table’s structure and meaning. Each row, column, and header must be correctly defined within the PDF’s tag tree for coherent navigation. For more information about tagging PDFs, read this article: What is a tagged PDF?
Here’s a sample table* that can be used to illustrate some of the barriers created by improper tagging of tables in PDFs. Here’s how a screen reader reads tables: Name, Column 1, Anna, Age, Column 2, 23, Height, Column 3 5.5, Weight, Column 4, 140.
| Name | Age | Height | Weight |
| Anna | 23 | 5.5 | 140 |
| Bruce | 57 | 6.0 | 180 |
| Lydia | 12 | 5.3 | 110 |
| Sidney | 40 | 5.10 | 165 |
| Mark | 38 | 6.2 | 205 |
Missing Header Tags
Headers are crucial for table navigation, as they provide context for the data within each cell. When headers are not tagged or incorrectly identified, users cannot determine which data belongs to which column or row. Properly tagged headers guide screen readers, allowing users to navigate through the table logically and understand the relationships between cells and headings.
Why this matters: In the sample table, the rows and column headers are needed to understand what the numbers are under each column header for each individual.
| Name | Age | Height | Weight |
| Anna | 23 | 5.5 | 140 |
| Bruce | 57 | 6.0 | 180 |
| Lydia | 12 | 5.3 | 110 |
| Sidney | 40 | 5.10 | 165 |
| Mark | 38 | 6.2 | 205 |
Complex or Nested Tables
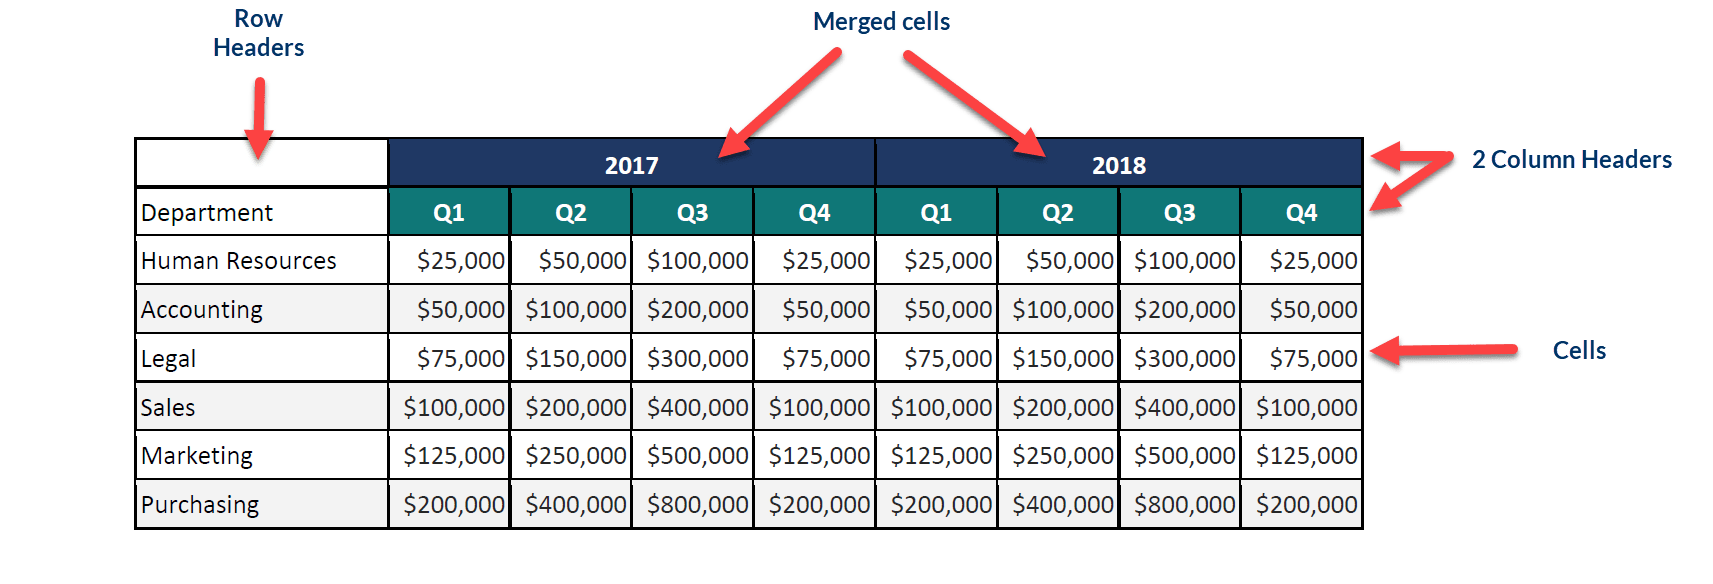
Complex tables with merged cells, nested structures, or irregular layouts can be particularly challenging to interpret. Each component must be explicitly tagged, and any merged cells should be identified to prevent confusion about which headers they should be associated with. For complex tables, providing a clear summary that explains the table structure and any irregularities is recommended to help users navigate effectively.
Why this matters: The sample table contains two column headers, and both the year header and the quarter header along with the row header of “Department” are needed to define each cell in the table so the budget numbers can be understood fully. Row 3 of this sample table above would read to a screen reader user: Department Column 1 Human Resources, 2023 Q1 Column 2 $25,000, 2023 Q2 Column 3 $50,000. Note that it informs the user of the column number and each header for every cell as well as the contents of the cell.
| 2022 | 2023 | |||||||
| Department | Q1 | Q2 | Q3 | Q4 | Q1 | Q2 | Q3 | Q4 |
| Human Resources | $25,000 | $50,000 | $100,000 | $25,000 | $25,000 | $50,000 | $100,000 | $25,000 |
| Accounting | $50,000 | $100,000 | $200,000 | $50,000 | $50,000 | $100,000 | $200,000 | $50,000 |
| Legal | $75,000 | $150,000 | $300,000 | $75,000 | $75,000 | $150,000 | $300,000 | $75,000 |
| Sales | $100,000 | $200,000 | 400,000 | $100,000 | 100,000 | $200,000 | $400,000 | $100,000 |
| Marketing | $125,000 | $250,000 | $500,000 | $125,000 | $125,000 | $250,000 | $500,000 | $125,000 |
| Purchasing | $200,000 | $400,000 | $800,000 | $200,000 | $200,000 | $400,000 | $800,000 | $200,000 |
Inadequate or Missing Table Summaries
Missing table summaries are common accessibility issues in PDF tables. A table summary provides an overview of the table’s structure, including details like the number of rows and columns, the presence of merged cells, and any other irregularities. This summary helps screen readers relay a comprehensive understanding of the table’s layout.
Why this matters: Without a summary, users may struggle to comprehend complex tables, particularly if the layout is unconventional. Our sample table contains two header rows, the first two containing merged cells. This is important because to understand each budget number, the screen reader user needs to know the department name, the year, and the quarter to which each dollar amount corresponds.
The Table Summary for this table reads, “Rows: 7; Columns: 9; Multiple header columns; Header rows contain column spans.”
| 2022 | 2023 | |||||||
| Department | Q1 | Q2 | Q3 | Q4 | Q1 | Q2 | Q3 | Q4 |
| Human Resources | $25,000 | $50,000 | $100,000 | $25,000 | $25,000 | $50,000 | $100,000 | $25,000 |
| Accounting | $50,000 | $100,000 | $200,000 | $50,000 | $50,000 | $100,000 | $200,000 | $50,000 |
| Legal | $75,000 | $150,000 | $300,000 | $75,000 | $75,000 | $150,000 | $300,000 | $75,000 |
| Sales | $100,000 | $200,000 | 400,000 | $100,000 | 100,000 | $200,000 | $400,000 | $100,000 |
| Marketing | $125,000 | $250,000 | $500,000 | $125,000 | $125,000 | $250,000 | $500,000 | $125,000 |
| Purchasing | $200,000 | $400,000 | $800,000 | $200,000 | $200,000 | $400,000 | $800,000 | $200,000 |
Improper Reading Order
The reading order in a table determines how assistive technology presents content to its users.
Why this matters: If this order isn’t set, screen readers may read cells in a confusing sequence, making it difficult to understand the relationships between data points. Proper reading order ensures that content flows in a logical sequence from one cell to the next, following a natural left-to-right, top-to-bottom sequence.
Blank Cells Not Identified
Blank cells within a table can cause confusion if not properly tagged. It is one of the more common accessibility issues in PDF tables.
Why this matters: Screen readers might interpret a blank cell as missing information or skip over it entirely. Having an unidentified blank cell in an otherwise full table can lead to the screen reader user thinking there is a missing element or that they have incorrectly navigated the table. Including the words “Blank cell” helps them understand there is no data there that is missing or invisible to their screen reader.
In our sample table here it is important to identify Row 1 Column 1 as a blank cell:
|
| 2022 | 2023 | ||||||
| Department | Q1 | Q2 | Q3 | Q4 | Q1 | Q2 | Q3 | Q4 |
| Human Resources | $25,000 | $50,000 | $100,000 | $25,000 | $25,000 | $50,000 | $100,000 | $25,000 |
| Accounting | $50,000 | $100,000 | $200,000 | $50,000 | $50,000 | $100,000 | $200,000 | $50,000 |
| Legal | $75,000 | $150,000 | $300,000 | $75,000 | $75,000 | $150,000 | $300,000 | $75,000 |
| Sales | $100,000 | $200,000 | 400,000 | $100,000 | 100,000 | $200,000 | $400,000 | $100,000 |
| Marketing | $125,000 | $250,000 | $500,000 | $125,000 | $125,000 | $250,000 | $500,000 | $125,000 |
| Purchasing | $200,000 | $400,000 | $800,000 | $200,000 | $200,000 | $400,000 | $800,000 | $200,000 |
Merged Cells Without Proper Tagging
Merged cells, which combine multiple rows or columns into a single header or data field, can be particularly problematic. Without proper tagging, assistive technology may fail to convey the relationship between the merged cell and the data it represents.
Why this matters: The data may not be associated with the correct corresponding column or row header. Clearly tagging merged cells and describing the spanning helps users understand the table’s structure. It avoids a lot of confusion when navigating the table using a keyboard. If the user is expecting to be able to read the contents in each cell of a column by arrowing across, having merged cells like in this sample table could be confusing since while the table is announced as having 9 rows and 9 columns, there are only 3 columns in row 1 due to merging. Knowing cells in row 1 have been merged avoids confusion.
Additionally, when navigating through the table, users can get “lost.” If the user is in Row 3 Column 3, and they arrow up twice, they will end up first in Row 2 Column 3, but then in Row 1 Column 2 due to the merged cells.
| 2022 | 2023 | |||||||
| Department | Q1 | Q2 | Q3 | Q4 | Q1 | Q2 | Q3 | Q4 |
| Human Resources | $25,000 | $50,000 | $100,000 | $25,000 | $25,000 | $50,000 | $100,000 | $25,000 |
| Accounting | $50,000 | $100,000 | $200,000 | $50,000 | $50,000 | $100,000 | $200,000 | $50,000 |
| Legal | $75,000 | $150,000 | $300,000 | $75,000 | $75,000 | $150,000 | $300,000 | $75,000 |
| Sales | $100,000 | $200,000 | 400,000 | $100,000 | 100,000 | $200,000 | $400,000 | $100,000 |
| Marketing | $125,000 | $250,000 | $500,000 | $125,000 | $125,000 | $250,000 | $500,000 | $125,000 |
| Purchasing | $200,000 | $400,000 | $800,000 | $200,000 | $200,000 | $400,000 | $800,000 | $200,000 |
Lack of Alternative Text for Embedded Images
Sometimes, tables may include embedded images, such as graphs or charts, to enhance the data. These visual elements must have alternative text (alt text) to describe their content and context.
Why this matters: Without alt text, assistive technology users miss out on crucial information shared by these visuals.
Inconsistent Use of Table Tags
Inconsistency in tagging—such as using paragraph tags for table elements instead of table-specific tags—can lead to confusion and incorrect rendering by screen readers. Using standardized, correct table tags ensures uniformity and better accessibility.
Best Practices for Remediating Tables
To address these issues, consider the following best practices:
- Use Specialized Tools: Tools like Equidox Software provide automated features, such as a Smart Table Detector, which help easily and correctly identify and tag tables, including rows, columns, and headers, as well as automatically creating a table summary. These tools streamline the remediation process, reducing the need for manual adjustments.
- Provide Clear Documentation: Adding detailed table summaries and ensuring proper reading order enhances usability. Descriptive summaries offer context, while a logical reading order ensures coherence for assistive technologies.
- Test with Assistive Technologies: After remediating a table, test it with screen readers like NVDA or JAWS to ensure it’s accessible. Manual testing helps catch issues that automated tools might miss.
Tagging Tables Ensures Inclusivity
Ensuring tables in PDF documents are accessible requires attention to tagging, structure, and usability. By addressing common accessibility issues in PDF tables such as untagged cells, missing headers, and complex structures, you can create documents that are inclusive and compliant with accessibility standards. Investing time in proper remediation and utilizing specialized tools will enhance user experience and demonstrate a commitment to digital inclusivity.
For more specific information about tagging tables using Equidox Software, check out this article: Easier PDF Accessibility: Tips for Tagging Tables
*NOTE: Sample tables are rendered in HTML for accessibility purposes and are not tagged as a table would be in a PDF.
Tammy Albee
Tammy Albee | Director of Marketing | Equidox Tammy joined Equidox after four years of experience working at the National Federation of the Blind. She firmly maintains that accessibility is about reaching everyone, regardless of ability, and boosting your market share in the process. "Nobody should be barred from accessing information. It's what drives our modern society."